Placement Records

| Batch/Placement Year | No. of students appeared | No. of students placed | Percentage |
|---|---|---|---|
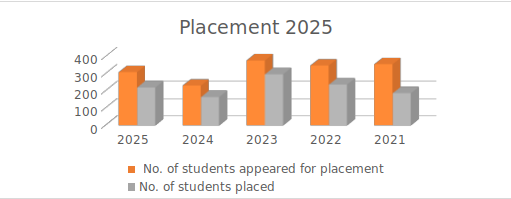
| 2025 | 310 | 221 | 71.29 |
| 2024 | 231 | 165 | 71.43 |
| 2023 | 378 | 297 | 78.57 |
| 2022 | 348 | 237 | 68.10 |
| 2021 | 356 | 187 | 52.53 |
Placement 2021 - 2025
| Course | No. of Companies Visited | No. of students Placed | Total Placement | % of total placment population |
|---|---|---|---|---|
| CSE | 83 | 82 | 65 | 79.3 |
| IT | 81 | 45 | 39 | 86.7 |
| ECE | 74 | 41 | 33 | 80.5 |
| EE | 41 | 24 | 13 | 54.2 |
| CE | 4 | 34 | 5 | 14.7 |
| MBA | 12 | 34 | 24 | 70.6 |
| MCA | 34 | 24 | 16 | 66.7 |
| HMCT | 9 | 26 | 26 | 100.0 |
| Total | 310 | 221 | 71.29 |